
For cost-optimization consultancies and the CFOs they serve
Turn projected savings into measured savings.
A success fee depends on proving savings for 36 months or more, and the proof usually comes from invoices and spreadsheets. For energy, water, gas, facilities and equipment, an invoice shows what was billed, not what was used. We come in as the wireless retrofit and analytics subcontractor: non-invasive sensors and gateways on meters, HVAC, irrigation, compressors and production equipment, with no IT project and no rewiring. Then a finance-grade monthly report, white-labelled for you, that sits beside your governance-ready reporting for the life of the engagement.
Your client, your levers, your fee. Our instruments, data and monthly proof. Without adding workload for the client.
At a glance
Outcomes you can bank, because they were metered.
The problem
Savings you can't measure are savings you can't bank.
The invoice is not the meter
Utility bills arrive monthly, estimated, lagged and aggregated across a site. A new tariff shows up on the invoice. A leak, a stuck valve or a compressor running all weekend does not, until the bill is wrong.
Projected is not verified
A sourcing win is modelled on last year's consumption. Weather, occupancy and behaviour move the number every month. Without a measured baseline the saving is an argument, not a figure.
Leakage creeps back
Thirty-six months is a long time to sustain value from a spreadsheet. Metered data, reviewed monthly, is how a consultant prevents leakage and keeps the saving on the books.
Who this is for
Built for the people whose fee depends on the proof.
Cost-reduction consultancies
You own the client and the commercial levers. We instrument the sites, normalise the data and produce the monthly proof under your brand. A recurring line that lasts the whole fee period, not just the first-year win.
Energy service companies
Measurement and verification for performance contracts, at the sub-meter level, with a method that does not change from month to month and a trail an auditor can follow.
Owners and finance teams
One report across the whole portfolio: what was used, what it cost, what it should have cost, and what to do about the gap. Written for a CFO, not a facilities engineer.
What we deploy
What we install: non-invasive, no IT project.
Clamps on, threads on, pushes in. Nothing needs power at the device, nothing touches the client's network.
Water
Pulse readers on the meters already in the ground, new wireless meters where there are none, pressure transducers at points of connection, and leak and continuous-flow detection from the overnight reads.
Electric and gas
Sub-metering with clamp-on current transformers on panels and major loads, and pulse readers on gas meters, so energy is seen by building, by tenant and by system.
Equipment and uptime
Current and vibration on compressors, pumps, chillers and lines, so availability, downtime and run hours are measured rather than estimated, and maintenance is called before the failure.
The network and the platform
A CHORA™ private network the client owns, a few gateways covering the estate, and MODURA holding the data, the validation and the report. Independent of the client's Wi-Fi and IT.
How an engagement runs
You bring us in. We bring the proof, every month.
Five steps, the first report about thirty days after the network is live.
-
1
You bring us in
Under your engagement, on your paper. We join at the opportunity assessment or after the sourcing win, whichever the client needs.
-
2
Site survey
A day per site: existing meters and their outputs, panels, equipment, gateway positions and backhaul. A fixed-fee quote follows.
-
3
Install
Pulse readers, sub-meters, pressure, current and condition sensors, and the CHORA network. Days per site, no trenching, no rewiring, no IT tickets.
-
4
Baseline
A prior-year baseline adjusted for weather and occupancy, written down and agreed with you and the client before the first report.
-
5
Monthly reports for 36 months
Baseline against actual, savings verified against the utility bills, leakage and anomaly flags, equipment availability. Delivered by the 7th, co-branded or white-label, for the life of the fee period.
The sample report
Two real reports, names changed.
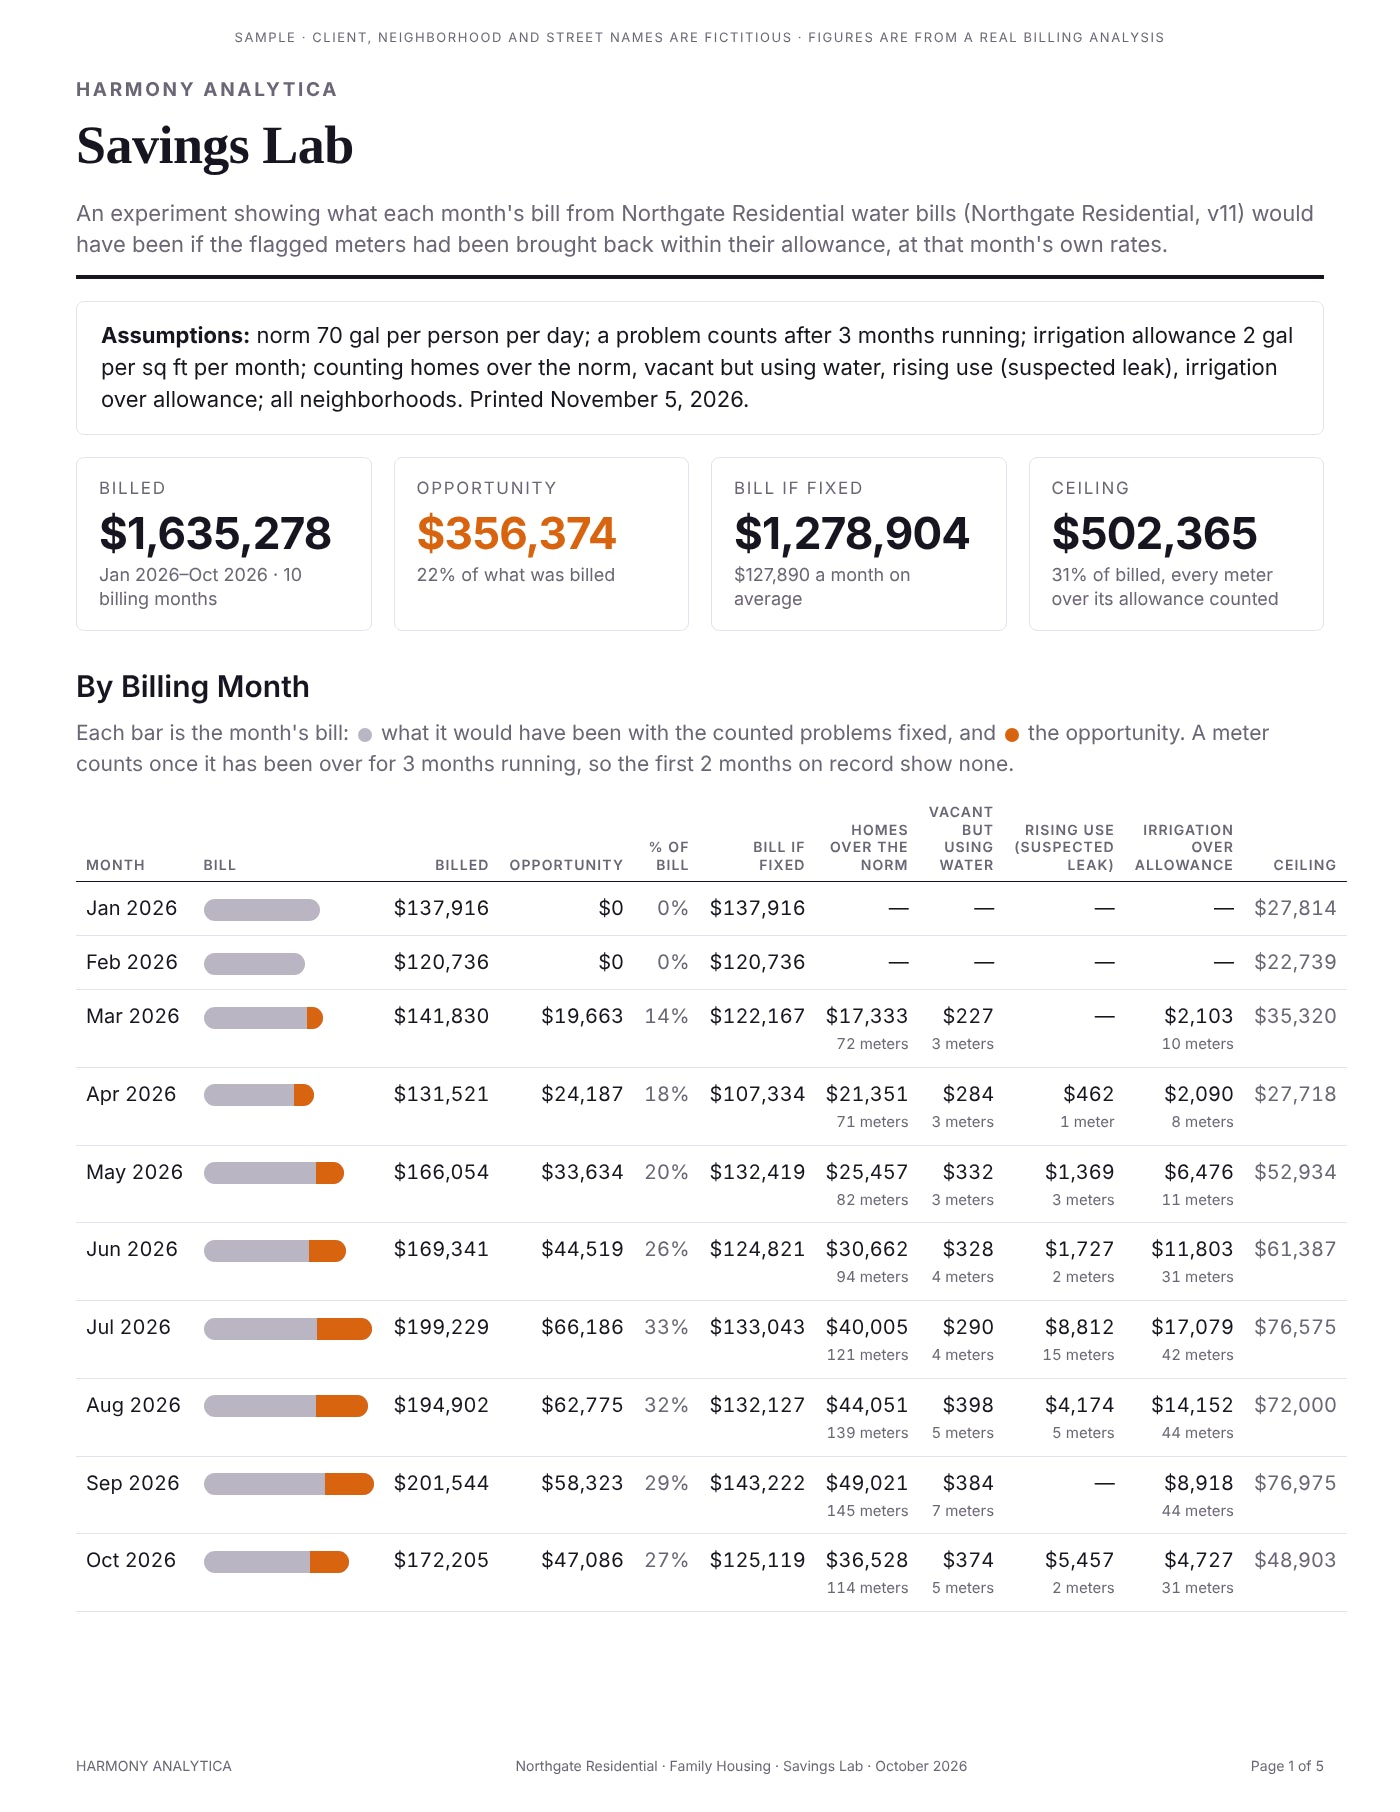
Both samples are reports we delivered in November 2026, reproduced with every client, neighborhood, street and address name replaced. The figures are unchanged. The first is a Savings Lab for a residential water portfolio: ten months of bills, the opportunity in each, and a work list ranked by dollars. The second is a monthly solar production report for a hospital campus array. Open any page full size, or download the full PDFs: Savings Lab, 5 pages and Solar Production Report, 3 pages.
What's in the report
Two formats, one discipline.
Whatever the utility, the report prices every figure at the real rate, ranks the work by dollars, and shows its method on the last page.
The headline in four numbers
For water: billed, opportunity, bill if fixed, and the ceiling. For solar: energy, revenue, certificates and combined value. The board slide is the first thing on page one.
Every month, at its own rates
A billing-month table with the opportunity split by cause, or production by day and by month with revenue on the second axis. Nothing is averaged across the year.
A work list ranked by dollars
Every flagged meter, largest first, with the cause, how many months it has run, gallons used and over, and whether the read was actual or estimated. The top twenty are where the first visits pay.
Certificates and carbon
Renewable energy certificates earned from the generation, banked energy toward the next one, their value at the state rate, and the carbon displaced at a stated grid factor.
How it is worked out
The yardstick for each cause, what was left out and why, and the rate every gallon or kilowatt-hour was priced at. The same page every month, so a change stands out.
The data behind it
Every figure traceable to the reads in the system of record. The PDF is the summary; the CSV has every row, and the data belongs to the client.
Pricing and partner model
Priced to you, so you can price it to your client.
We are built to sit behind a consultancy. A fixed fee per site for the survey and retrofit, and a monthly fee per site for the data and the report, for as long as your fee period runs. You set the client price and keep the margin, or pass it through. Co-branded or white-label, your choice. The network, the data and the reports belong to the client, which is what lets you say the saving is theirs to keep.
The terms we work to
- We never contact your client without you
- The network, the data and the report belong to the client
- Fixed fee per site to retrofit, monthly fee per site for the report, for the whole fee period
- Your brand on the cover, ours in the method notes, or neither
Proof
One portfolio, 300 million gallons, every month since 2024.
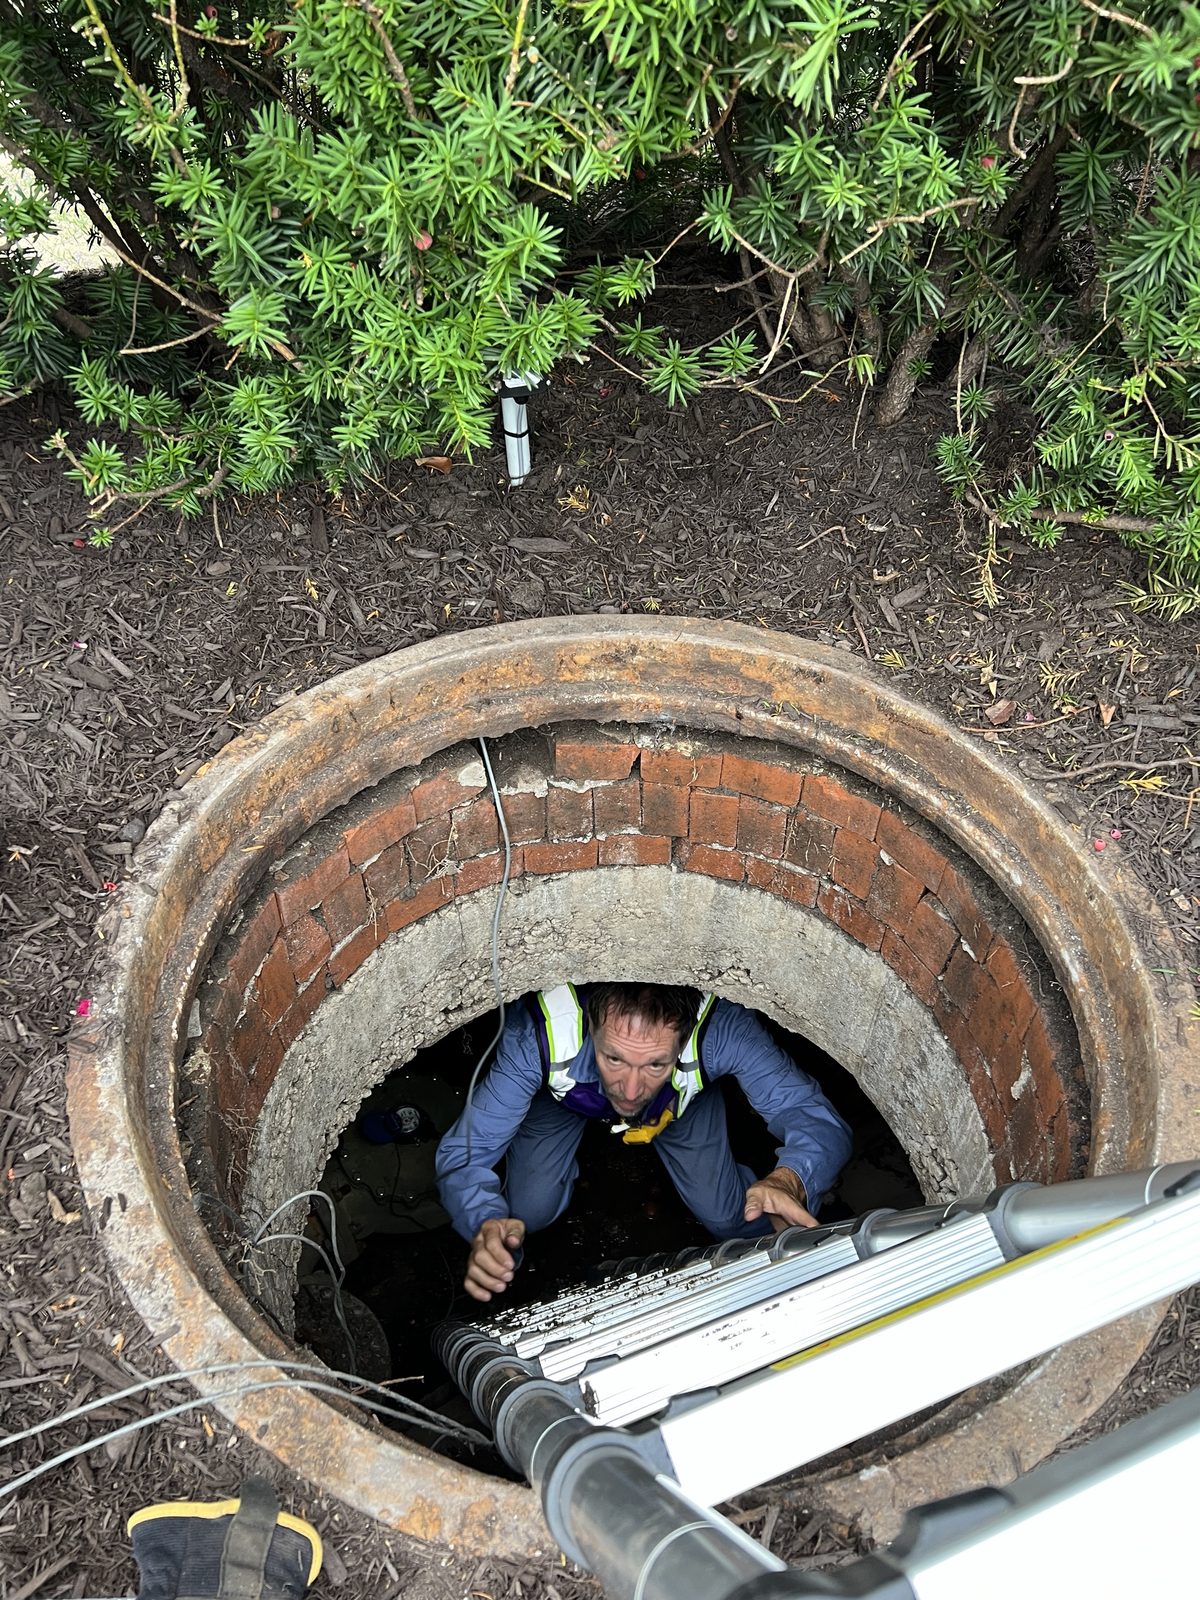
On a residential portfolio of about 5,700 meter points, our pipeline has ingested daily reads, screened every meter, and produced the monthly billing and efficiency package by the 7th, every month since 2024, under a multi-year service contract. More than 300 million gallons metered and more than $600,000 in documented savings. We can say more in a conversation than we can on a web page.
Report specification
| Item | Standard |
|---|---|
| Data sources | Wireless meter reads every 15 minutes over a CHORA™ private network; pressure, leak and condition sensors; utility bills; occupancy file; on-site weather |
| System of record | Daily ingestion into a time-series store keyed by unit and timestamp, with the source file recorded for every reading |
| Baseline | A prior-year period, adjusted for weather (evapotranspiration and rainfall) and occupancy. Documented at program start and unchanged without a written note |
| Validation | Every period: meters screened for gaps and non-incrementing values; reviewer confirms occupancy, rates, date range and each flagged meter. Flagged meters are excluded from savings until verified |
| Cadence | Monthly, delivered by the 7th, or the next business day |
| Formats | PDF summary, the Excel workbook behind it, a MODURA dashboard, and an API or data export for your own systems |
| Branding | Co-branded or white-label |
| Ownership | Network, data and reports belong to the client |
The sample reports on this page are reproductions of two reports delivered in November 2026. Every client, neighborhood, street, address and site image has been replaced with a fictitious one; the figures have not been changed.
Questions
Efficiency reports, answered.
Do the meters have to be replaced?
Usually not. Most utility meters have a pulse or encoder output, and a wireless reader clamps or threads onto it. We replace a meter only when it has no output or is past its life, and we say so in the audit.
Which utilities can the report cover?
Water and sewer first, because that is where irrigation and leaks hide the money. Electric sub-metering and gas pulse reads go on the same network and into the same report.
Can it carry our brand?
Yes. The report can be co-branded or fully white-label. The method notes name whoever you want them to name.
Who owns the data?
Your client. The network is theirs, the system of record is in their name, and the workbook behind every report is delivered with it.
How soon after the retrofit does the first report arrive?
About thirty days after the network is live, so there is a full period of validated reads behind it. The baseline is set before that, from a prior year and the bills.
Harmony Analytica
Bring us into the next engagement.
Tell us the client, the sites and the categories. We will say what to instrument, what it costs, and what the first report would show, before anything is ordered. Email andy@harmonyanalytica.com or call 208-908-3229.