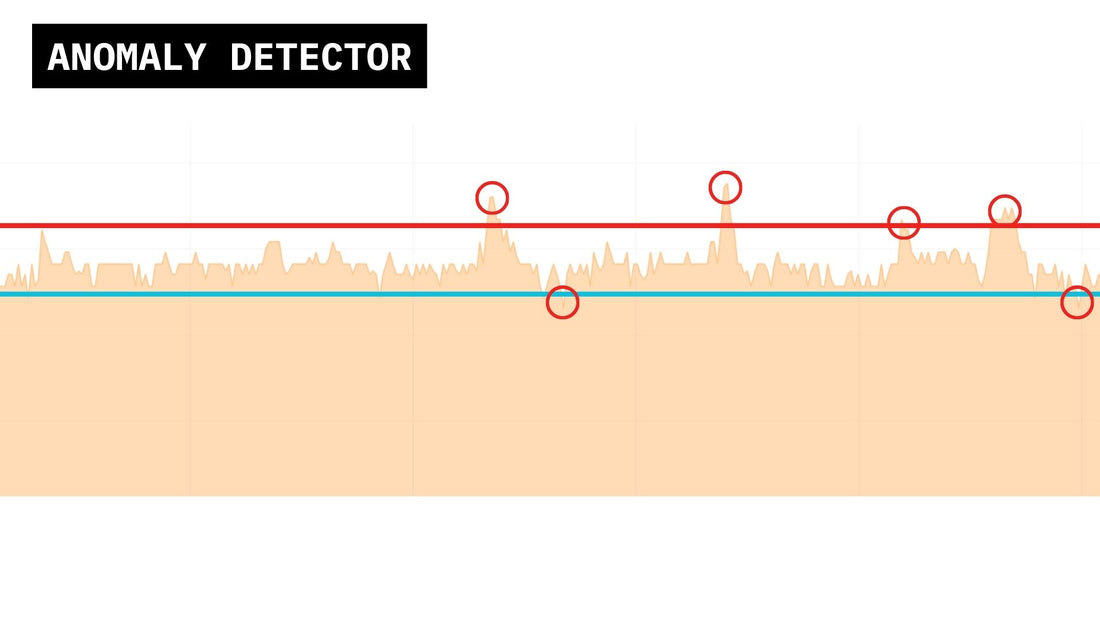
Anomaly Detection: A Critical Tool in Water Management
Share
In today's data-driven world, the ability to monitor and analyze time series data is paramount for building managers, chief sustainability officers, and ESG officers. However, amidst the vast and continuous stream of data, identifying anomalies—those unexpected deviations from the norm—can be an arduous task, often akin to finding needles in a haystack.
Harmony Analytica has recognized the critical need for automated anomaly detection to empower its users to quickly spot irregularities in their time series data. This article delves into a solution offered by Harmony: the Anomaly Detector, a tool that's not only innovative but indispensable for efficient water management and conservation practices.
Requirements
To leverage the Anomaly Detector, users need a Harmony Custom IoT subscription.
Understanding Anomalies
Anomalies, or outliers, are data points that significantly deviate from the expected behavior of a dataset. Identifying these anomalies is crucial as they can impact statistical analysis and conclusions drawn, signaling errors in data collection, measurement inaccuracies, or genuinely unusual events.
The Power of Algorithms: Z-Score and MAD
Harmony integrates advanced algorithms, namely Z-score and MAD (Median Absolute Deviation), to identify anomalies effectively. These statistical approaches quantify deviations from expected data patterns, with Z-score focusing on standard deviations from the mean and MAD measuring the median of absolute deviations from the dataset's median.
Z-Score (Standard Score)
The Z-score is particularly useful for data that follows a normal distribution, offering a straightforward method to identify data points that are significantly different from the mean. Common thresholds for identifying outliers are set at ±2 or ±3 standard deviations, depending on the desired sensitivity.
MAD (Median Absolute Deviation)
MAD offers a robust alternative for data that may not follow a normal distribution, less affected by outliers and suitable for skewed or heavy-tailed distributions. Similar to Z-score, thresholds of ±2 or ±3 MADs help identify potential outliers.
Algorithm Selection and Data Characteristics
The choice between Z-score and MAD should be guided by the data's distribution, skewness, and kurtosis. Z-score is ideal for normally distributed data, while MAD is preferable for non-normally distributed data, ensuring accurate anomaly detection across various data characteristics.
Right MAD and Left MAD
The concepts of Right MAD and Left MAD allow for comprehensive anomaly detection by focusing on data points to the right and left of the median, respectively. This approach ensures anomalies are detected across the entire data distribution.
Conclusion
The Harmony Anomaly Detection Plugin stands as a testament to the power of data analytics in modern water management. By harnessing statistical algorithms like Z-score and MAD, water management professionals can detect anomalies in real-time, preventing wastage, optimizing resources, and ensuring sustainable practices. As the world moves towards more sophisticated water management strategies, tools like the Harmony Anomaly Detector will be indispensable in navigating the complexities of data-driven decision-making.
